Businessweek
Leading dataviz
I led research and design for a suite of visual news stories in a Businessweek special issue — a retrospective of the five years since the 2008 financial crisis.
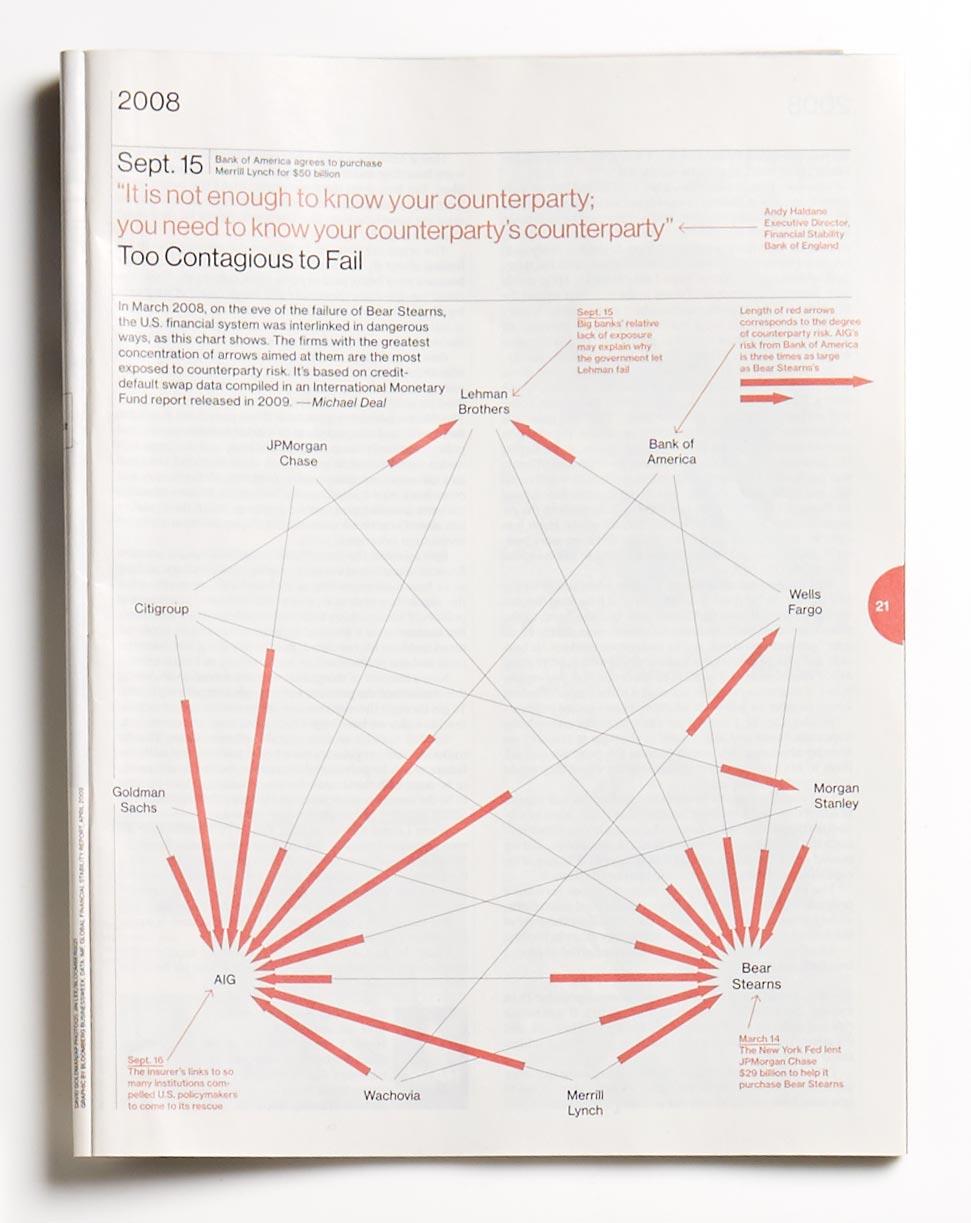
Too Contagious to Fail
Diagram showing the dangerous connections between major financial institutions on the eve of the collapse. Concentrations of longer arrows indicate more exposure to counterparty risk.
Key index timelines
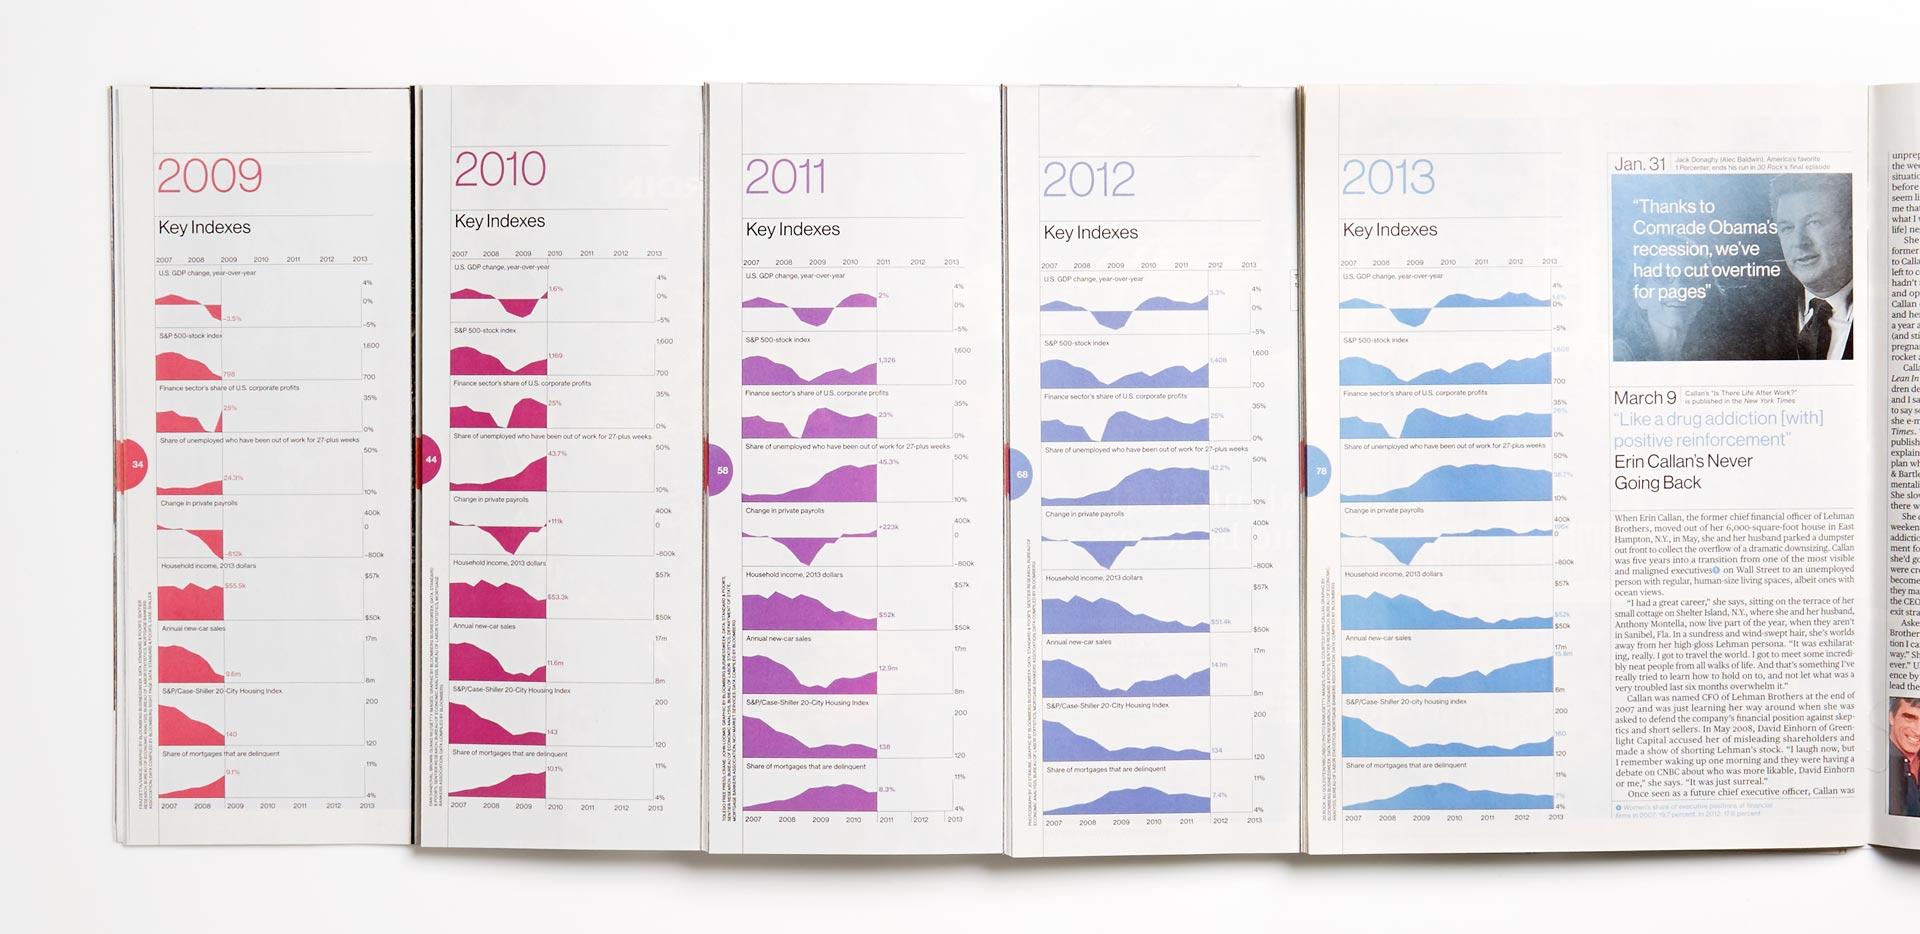
The issue was divided into a section for each year since the collapse. Each year opens with a stack of graphs showing key economic indexes — GDP, household income, and others — with more of each index revealed as the issue unfolds.
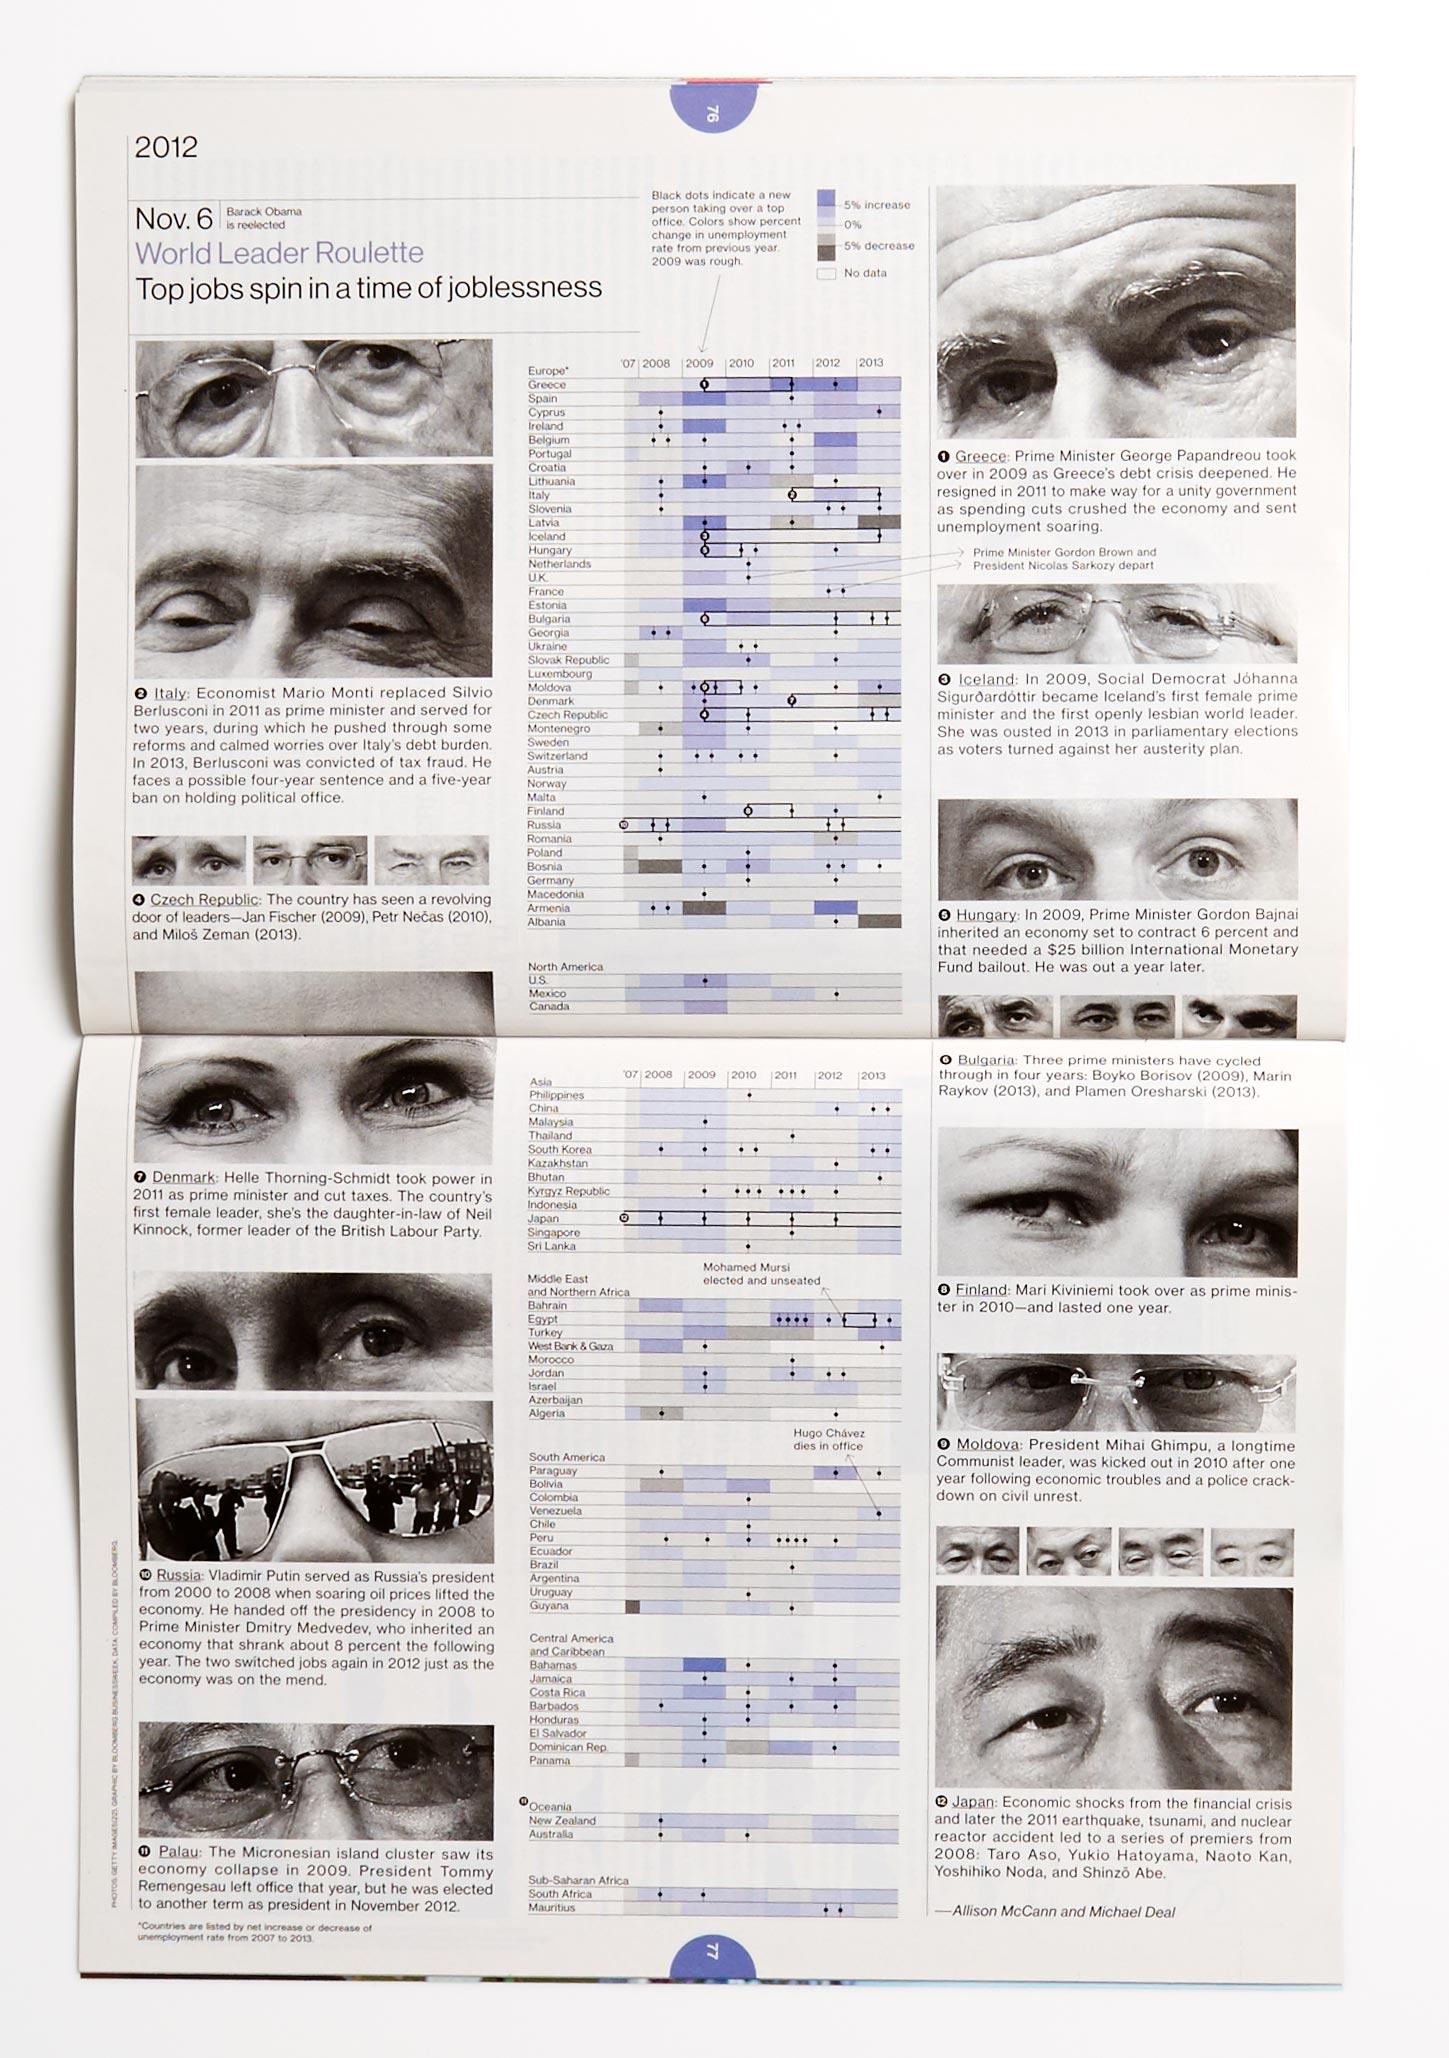
World Leader Roulette
The purple heatmap shows drops in unemployment from 2007–2013, serving as the stage over which different world leaders come and go (marked by black dots). Eye-crops made for a more engaging set of headshots. Designed with Allison McCann.